Dendrochronogram or Tree-Ring Graph
One of the hardest things to visualize is information that depends on time and space. These are known as “spatio-temporal” visualizations or “space-time cubes”, several techniques have been proposed to deal with the complexity of seeing both information at the same time.
Here I propose a new* and very simple visualization that shows where and when, I call it “Tree-Ring Graph”.
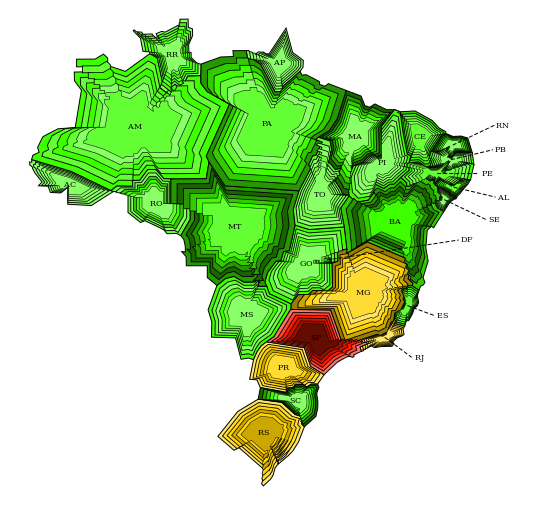
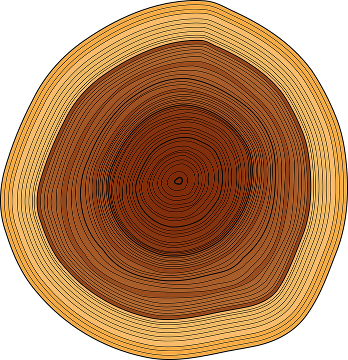
The idea comes from choropleths and tree-ring analysis. Inner rings are “older” than outer ones, color intensity shows quantity. It’s easy to spot trends: if something is getting darker, it’s increasing; if something is getting lighter, it’s decreasing. Cycles are also easy to spot: any “zebra-like” shape is cyclic.
I found the main limitation is the number of rings, fewer rings works better, some summarization over data may be needed. Also, it’s not good for precise locations.
Code for d3js can be found here.
*“new” as in “I couldn’t find anybody who had done it before”, which could mean I did a poor research. :)